101
click to vote
VIS
2008
IEEE
16 years 3 months ago
2008
IEEE
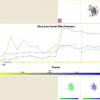
Abstract--Scatterplots are well established means of visualizing discrete data values with two data variables as a collection of discrete points. We aim at generalizing the concept...
113
click to vote
VIS
2008
IEEE
16 years 3 months ago
2008
IEEE
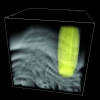
In this work we present basic methodology for interactive volume editing on GPUs, and we demonstrate the use of these methods to achieve a number of different effects. We present f...
135
click to vote
VIS
2008
IEEE
16 years 3 months ago
2008
IEEE
The visualization of complex 3D images remains a challenge, a fact that is magnified by the difficulty to classify or segment volume data. In this paper, we introduce size-based tr...
103
click to vote
VIS
2008
IEEE
16 years 3 months ago
2008
IEEE
The method of Moving Least Squares (MLS) is a popular framework for reconstructing continuous functions from scattered data due to its rich mathematical properties and well-underst...
109
Voted
VIS
2007
IEEE
16 years 3 months ago
2007
IEEE
137
Voted
VIS
2007
IEEE
16 years 3 months ago
2007
IEEE
Recent developments in biomedical imaging are producing massive data sets containing structures, such as fine filaments, that are difficult to visualize. In this paper, we describ...
135
Voted
VIS
2007
IEEE
16 years 3 months ago
2007
IEEE
The effectiveness of direct volume rendering is difficult to validate and users may not know whether they have successfully explored the data or not. This limits its applications....
131
Voted
VIS
2007
IEEE
2007
IEEE
Modeling Perceptual Dominance Among Visual Cues in Multilayered Icon-based Scientific Visualizations
16 years 3 months ago
ization method is an abstract function that transforms a scientific dataset into a visual representation to facilitate data exploration. In turn, a visualization display is the vis...
132
Voted
VIS
2007
IEEE
16 years 3 months ago
2007
IEEE
In nature and in flow experiments particles form patterns of swirling motion in certain locations. Existing approaches identify these structures by considering the behavior of stre...
145
click to vote
VIS
2007
IEEE
16 years 3 months ago
2007
IEEE
We present a novel approach for analyzing two-dimensional (2D) flow field data based on the idea of invariant moments. Moment invariants have traditionally been used in computer vi...


