IV
2002
IEEE
14 years 5 months ago
2002
IEEE
This paper introduces an immersive virtual reality application that allows users to browse and explore the contents of database systems. We have implemented a visualization metaph...
IV
2002
IEEE
14 years 5 months ago
2002
IEEE
We apply fillets — smoothing of sharp angles at the joints — between the connections and nodes of graph-like diagrams. In situations where the graph layout is constrained, e....
IV
2002
IEEE
14 years 5 months ago
2002
IEEE
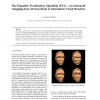
from Abstract Data to Naturalistic Visual Structure A. Loizides and M.Slater Department of Computer Science, University College London (UCL), London, UK This paper demonstrates a ...
IV
2002
IEEE
14 years 5 months ago
2002
IEEE
Topic Maps provide a bridge between the domains of knowledge representation and information management by building a structured semantic network above information resources. Our r...
IV
2002
IEEE
14 years 5 months ago
2002
IEEE
We present a new visualization approach for metadata combining different visualizations into a so-called SuperTable accompanied by a Scatterplot. The goal is to improve user exper...
IV
2002
IEEE
14 years 5 months ago
2002
IEEE
The paper presents a virtual reality modeling system based on interactive web technologies. The system’s goal is to provide a user-friendly virtual environment for the developme...
IV
2002
IEEE
14 years 5 months ago
2002
IEEE
Bringing Production Work Flow to a Classroom Teaching
IV
2002
IEEE
14 years 5 months ago
2002
IEEE
Box plot is a compact representation that encodes the minimum, maximum, mean, median, and quartile information of a distribution. In practice, a single box plot is drawn for each ...
IV
2002
IEEE
14 years 5 months ago
2002
IEEE
The research discussed here is a component of a larger study to explore the accessibility and usability of spatial data presented through multiple sensory modalities including hap...
IV
2002
IEEE
14 years 5 months ago
2002
IEEE

