90
Voted
IV
2005
IEEE
15 years 7 months ago
2005
IEEE
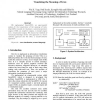
We implemented SmartINFO, an experimental system for the visualization of the meaning of texts. SmartINFO consists of 4 modules: a universal grammar engine (UGE), an anaphora engi...
85
Voted
IV
2005
IEEE
15 years 7 months ago
2005
IEEE
123
click to vote
IV
2005
IEEE
15 years 7 months ago
2005
IEEE
The visual analysis of time dependent data is an essential task in many application fields. However, visualizing large time dependent data collected within a spatial context is st...
120
click to vote
IV
2005
IEEE
15 years 7 months ago
2005
IEEE
Lowering computational cost of data analysis and visualization techniques is an essential step towards including the user in the visualization. In this paper we present an improve...
118
click to vote
IV
2005
IEEE
15 years 7 months ago
2005
IEEE
This paper contains details of new criteria for graph layout, based on the concepts used in graphical design. Current graph layout criteria have been shown to be effective in meas...
111
click to vote
IV
2005
IEEE
15 years 7 months ago
2005
IEEE
In this paper we describe a tool to improve interfunctional communication of project plans by displaying them as a metro map. Our tool automatically lays out plans using a multicr...
106
click to vote
IV
2005
IEEE
15 years 7 months ago
2005
IEEE
Visualization and knowledge of detailed pressure information can play a vital role in multimodal sensing of human movement. We have designed a highresolution pressure sensing floo...
IV
2005
IEEE
15 years 7 months ago
2005
IEEE
Visualisation systems consisting of a set of components through which data and interaction commands flow have been explored by a number of researchers. Such hybrid and multistage ...
103
click to vote
IV
2005
IEEE
15 years 7 months ago
2005
IEEE
Polygonal meshes are used in many areas to model different objects and structures. Depending on their applications, they sometimes have to be processed to, for instance, reduce th...
119
click to vote
IV
2005
IEEE
15 years 7 months ago
2005
IEEE
Transition systems are graphs and it is natural to consider their visual representation as a graph visualization problem. They also pose an interesting multidimensional visualizat...
