123
click to vote
VISUALIZATION
2005
IEEE
15 years 7 months ago
2005
IEEE
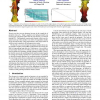
Visualization users are increasingly in need of techniques for assessing quantitative uncertainty and error in the images produced. Statistical segmentation algorithms compute the...
138
click to vote
VISUALIZATION
2005
IEEE
15 years 7 months ago
2005
IEEE
GPU-based raycasting offers an interesting alternative to conventional slice-based volume rendering due to the inherent flexibility and the high quality of the generated images. ...
124
Voted
VISUALIZATION
2005
IEEE
15 years 7 months ago
2005
IEEE
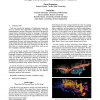
We present a visual analysis and exploration of fluid flow through a cooling jacket. Engineers invest a large amount of time and serious effort to optimize the flow through thi...
136
click to vote
VISUALIZATION
2005
IEEE
15 years 7 months ago
2005
IEEE
As standard volume rendering is based on an integral in physical space (or “coordinate space”), it is inherently dependent on the scaling of this space. Although this dependen...
VISUALIZATION
2005
IEEE
15 years 7 months ago
2005
IEEE
118
click to vote
VISUALIZATION
2005
IEEE
15 years 7 months ago
2005
IEEE
Traditionally, time-varying data has been visualized using snapshots of the individual time steps or an animation of the snapshots shown in a sequential manner. For larger dataset...
VISUALIZATION
2005
IEEE
15 years 7 months ago
2005
IEEE
Recent years have seen an immense increase in the complexity of geometric data sets. Today’s gigabyte-sized polygon models can no longer be completely loaded into the main memor...
131
click to vote
VISUALIZATION
2005
IEEE
15 years 7 months ago
2005
IEEE
Tensors occur in many areas of science and engineering. Especially, they are used to describe charge, mass and energy transport (i.e. electrical conductivity tensor, diffusion ten...
VISUALIZATION
2005
IEEE
15 years 7 months ago
2005
IEEE
This paper describes an experimental study of three perceptual properties of motion: flicker, direction, and velocity. Our goal is to understand how to apply these properties to ...
VISUALIZATION
2005
IEEE
15 years 7 months ago
2005
IEEE


